From an intelligent chat interface for data analysis on WhatsApp to powerful BI systems for management, monitoring, and decision-making.


The simple way to understand data – in one chat
A smart chat interface for extracting data and analyzing from your data sources
✔ Also works on WhatsAppI
✔ No technical knowledge requiredI
✔ Instant data-driven answersI
Suitable for:I
Any user in any organization
Work with diverse data sources
Read more about Simm.AI
Smart Data Modeling – No Code, No Headache
An advanced ETL tool for building data models automatically, quickly and user-friendly.
The system identifies relationships between tables, maps data and dramatically shortens the integration phase in BI processes.
Designed for:
✔ Developers
✔ Data / BI professionals
✔ Software houses
Read more about Simm.Data
Management Dashboard and Operational Dashboard
All operational data and actions required for the workflow are located in one management dashboard. The central screen provides a complete and comprehensive picture, allowing you to control, manage and respond quickly to operational changes and gain full control to make the business more productive and efficient.
Get a significant advantage in speed and affordability with business intelligence for your product. Embedded BI enables the integration of management dashboards, reports, and analytical tools into systems such as ERP systems, CRM, SaaS platforms, websites, applications, and more.
Arena (PLM) – Priority (ERP)
SimmTech has been selected to be the official integration partner of Arena from the PTC Group in interface solutions between Arena’s PLM software and Priority ERP.

SimmbiTech brings organizations and businesses a new way to work with data.
The unique combination of Simm.Data, Simm.BI, and Simm.AI transforms raw data into business insights—quickly, simply, and without reliance on programmers.
Simm.Data automatically maps and connects data sources across the organization, builds a unified and reliable data model, and saves tens to hundreds of hours of valuable work.
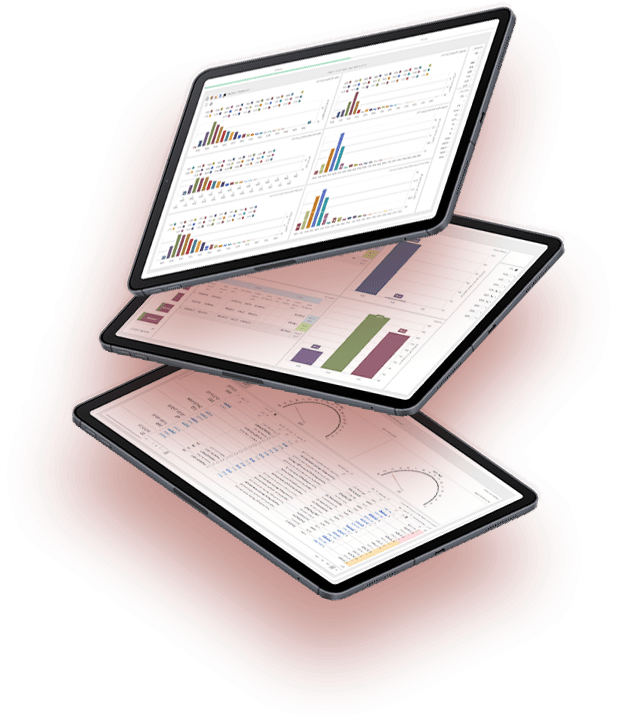
On top of this foundation, Simm.BI delivers advanced dashboards, clear management reports, and full control—exactly what executives need to stay on top of the business.

SimmbiTech’s technology enables a breakthrough in business data analysis:
from management reports and scheduled reports, through clear dashboards and visualizations, to free, real-time data exploration—including direct access to data via Simm.AI through an intelligent chat interface.
SimmbiTech’s solutions empower a wide range of professionals—analysts, economists, accountants, ERP implementers, and business consultants—enabling them to make data-driven decisions easily, quickly, and without dependence on programmers.


Simm.BI enables business consultants and analysts to use advanced BI tools instead of working with Excel
Simm.BI gives you additional revenue by providing BI services to your customers: business intelligence solutions at prices that are suitable for SMB companies
Simm.BI enables BI planners of all existing systems to build data warehouses quickly and easily
Simm.BI enables all SMB analysts and managers to build reports and dashboards, and analyze data from their information systems, without needing programmers.
FAQ
SaaS = Software as a Service; this is software that resides in the cloud (a secure external server), enabling the organization to use it from anywhere in the world without the need for a local installation on any computer. Access to the software is based on an Internet connection, and being external software, backups and data security are enabled at the highest level.
The organization’s information is secured by a very heavy security system with 6 layers of protection, which makes it easier to break into the organization’s computers in order to obtain information than to try to obtain information through Simm.BI.
Key differences:
Simm.BI is the only system in the world today that requires only a few hours of integration.
Simm.BI is the only system in the world today that connects to the company’s database in only a few minutes.
The system is so easy to understand and operate that every end user can produce complex reports, as opposed to complex systems for operations that only company employees can use.
Allows you to work from mobile devices (not just view reports but all options).
There is no need to make “preparations” for the data; neither is there need to export to Excel or upload data to a particular format file – one simply extracts the report and continues to work.
Simm.BI is suitable for small and medium businesses who are not interested in investing a lot of money in expensive BI products.
Companies with an information system (including ERP) who want to obviate the need for a programmer or implementor to build reports, saving valuable working hours in building reports and making it easier to work with them.
Companies that can not build reports from their information systems, not even with programmers.
Companies that are interested in improving the ability to make decisions based on real data and reduce decision-making based on assumptions .
Companies with a number of information systems (or different sources of information) interested in cross-checking data from different fields, sometimes or on a regular basis.
Companies that are interested in purchasing a BI system but are not sure that the system will return the large investment required.
Companies that do not have programmers or professionals who are able to maintain complex BI systems.
Companies that want to allow managers to see reports even when they are out of the office, using scheduled email reports or building and producing reports remotely.
Companies that wish to use dynamic reports, which even after their creation can be designed, added to, moved to or displayed in different ways in order to to find answers to important questions.
Companies that use BI systems but not in all departments, and are interested in providing a solution for those departmentswithout access to the BI system.
Simm BI works with any database based on SQL (the vast majority of existing databases). it is reasonable to assume that your database is supported, unless your system was written by a programmer who decided to ignore standards.
There is a minimum commitment to use Simm.BI for only 6 months.
If the system has not improved work in the organization sufficiently, you can cease using it without an exit penalty or any other cost.
Simm.BI is an easy-to-use system; usually a few hours’ training are required to prepare you for using the system and generating reports.
Simm.BI Technologies has an array of instructors and integrators who will assist you in the immediate use of the system in order to achieve your goals.
Since this is a SaaS product, there is no need to install the system; a simple initial connection of the system to the company server is all that is required!
This connection, which should take only a few minutes, can be done by anyone who knows the password to the server and can use the technical support of Simm.BI Technologies.
The Simm.BI connection is done in exactly the same way as for a desktop computer.
You do not need to install an app, just sign in to the secure site and download reports.
No, there is no limit at all in the Builder package. One of the advantages of Simm.BI Builder is the ease and simplicity of a report, that makes it easier to make decisions based on accurate data and to check all assumptions through reports. This is in place of the old situation in which only significant decisions were supported by accurate information.
OLAP cubes are a solution for organizations that do not use Simm.BI and are nevertheless interested in enabling end-users to build reports on their own – in a limited and predetermined domain . Simm.BI does not need these tools because users can build reports from any domain and module in the real-time information system, without the need to program a specific solution for each case.
Even after a report has been built, it is still limited to production. If you forward existing reports to Simm.BI, you can:
Explore the report by searching it and cutting data from it.
Merge it with another report (even if it is from another information system) to create one report that joins all data.
Transform the report into any type of graph, without the need for producing it again.
Format or modify the report (add, remove, or hide columns, change input fields, etc.).
Place the data in different places of the pivot table, replace and examine from any angle.
Add the report to a dashboard or even to your homepage.
Allow people who do not have access to your information system to generate the report with appropriate permissions.
Get your reports from mobile devices wherever you want.
Schedule production of reports and send them to email or SMS.
הודעת וואטסאפ